The Raspberry Shake has some nice software available with it. One of the nicest things to start out with is an app available for Android phones called “EQInfo“. It provides a list of recent earthquakes, as detected by various monitoring agencies. You can click on a quake, and see a seismometer’s trace of the event. By default, it will show the trace from whatever Raspberry shake is nearest the event, but you can easily change the settings to show the event as recorded by your own Raspberry Shake.
Here are some of the more obvious earthquakes detected during my first week, as seen on my own Raspberry Shake, ordered from nearest to farthest. Note that none of these events were perceptible by humans at my location.
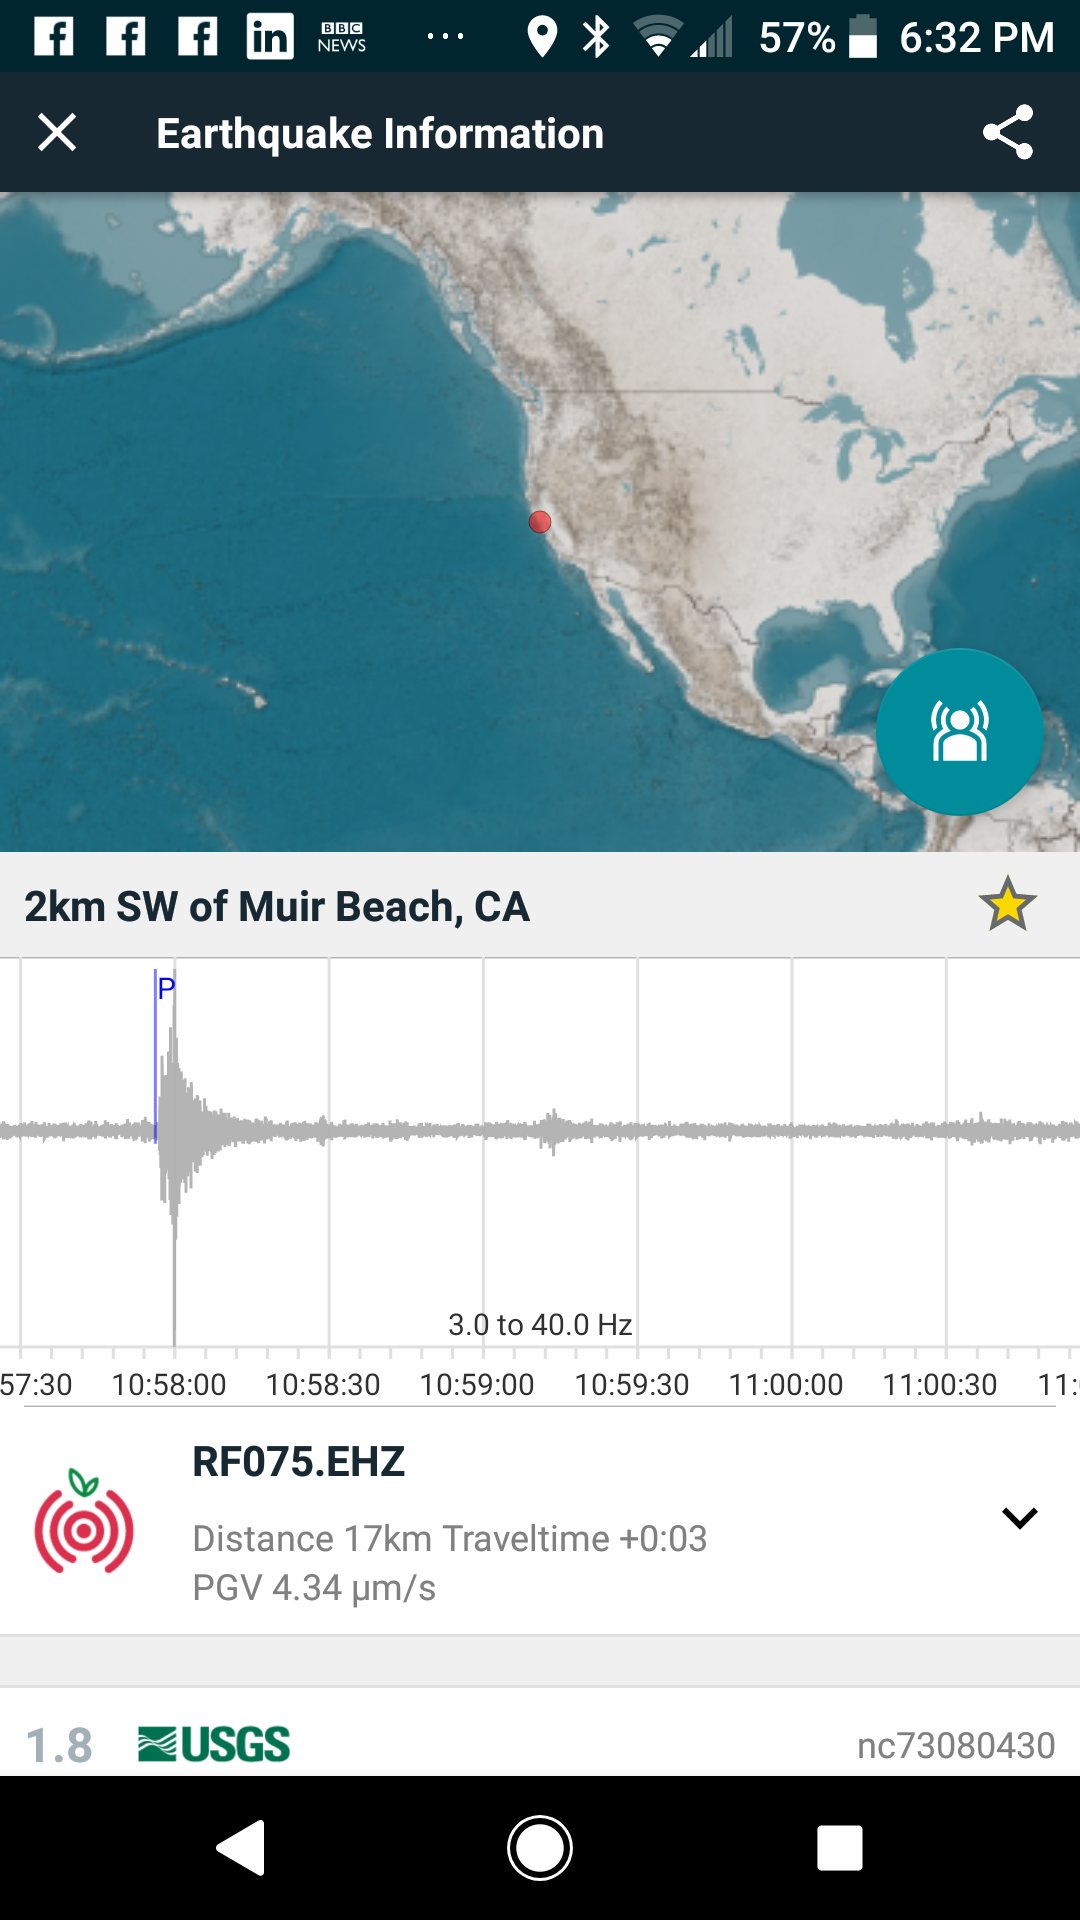
M1.8, 17km 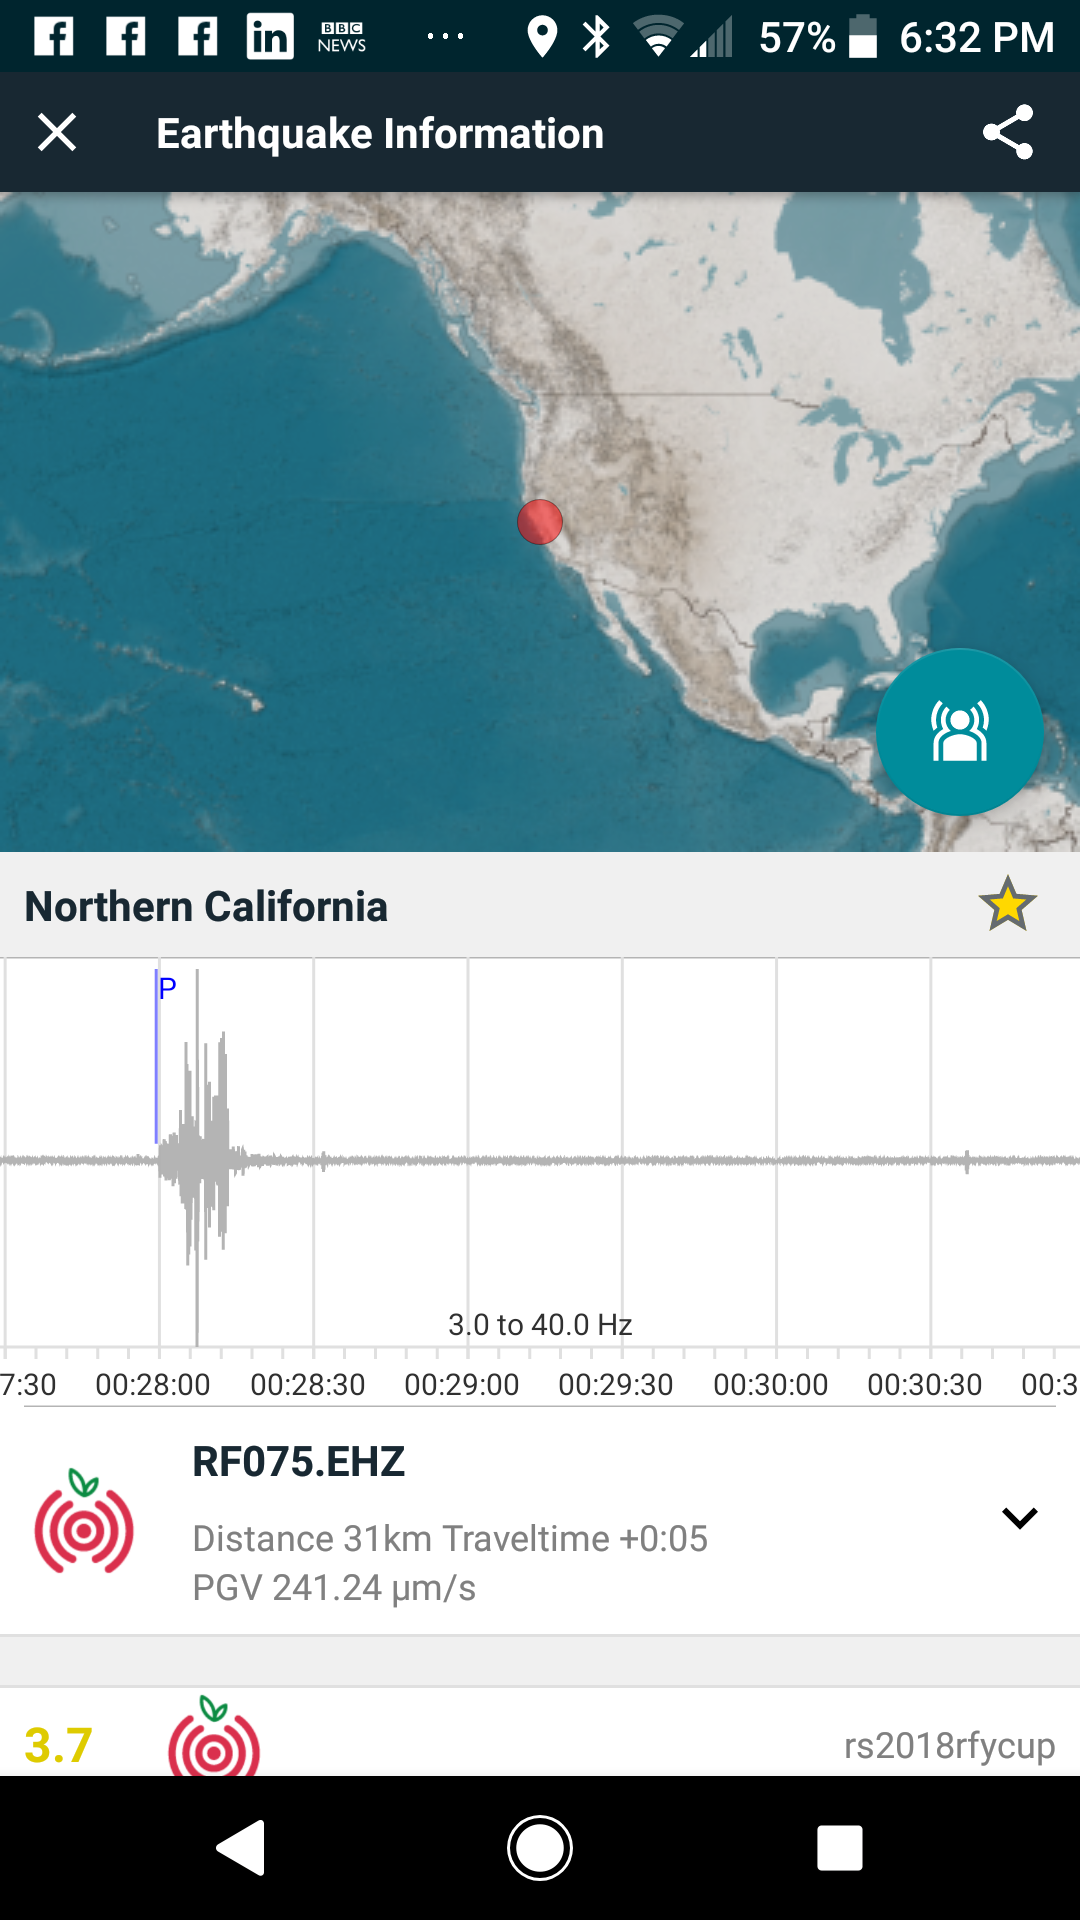
M3.7, 31km 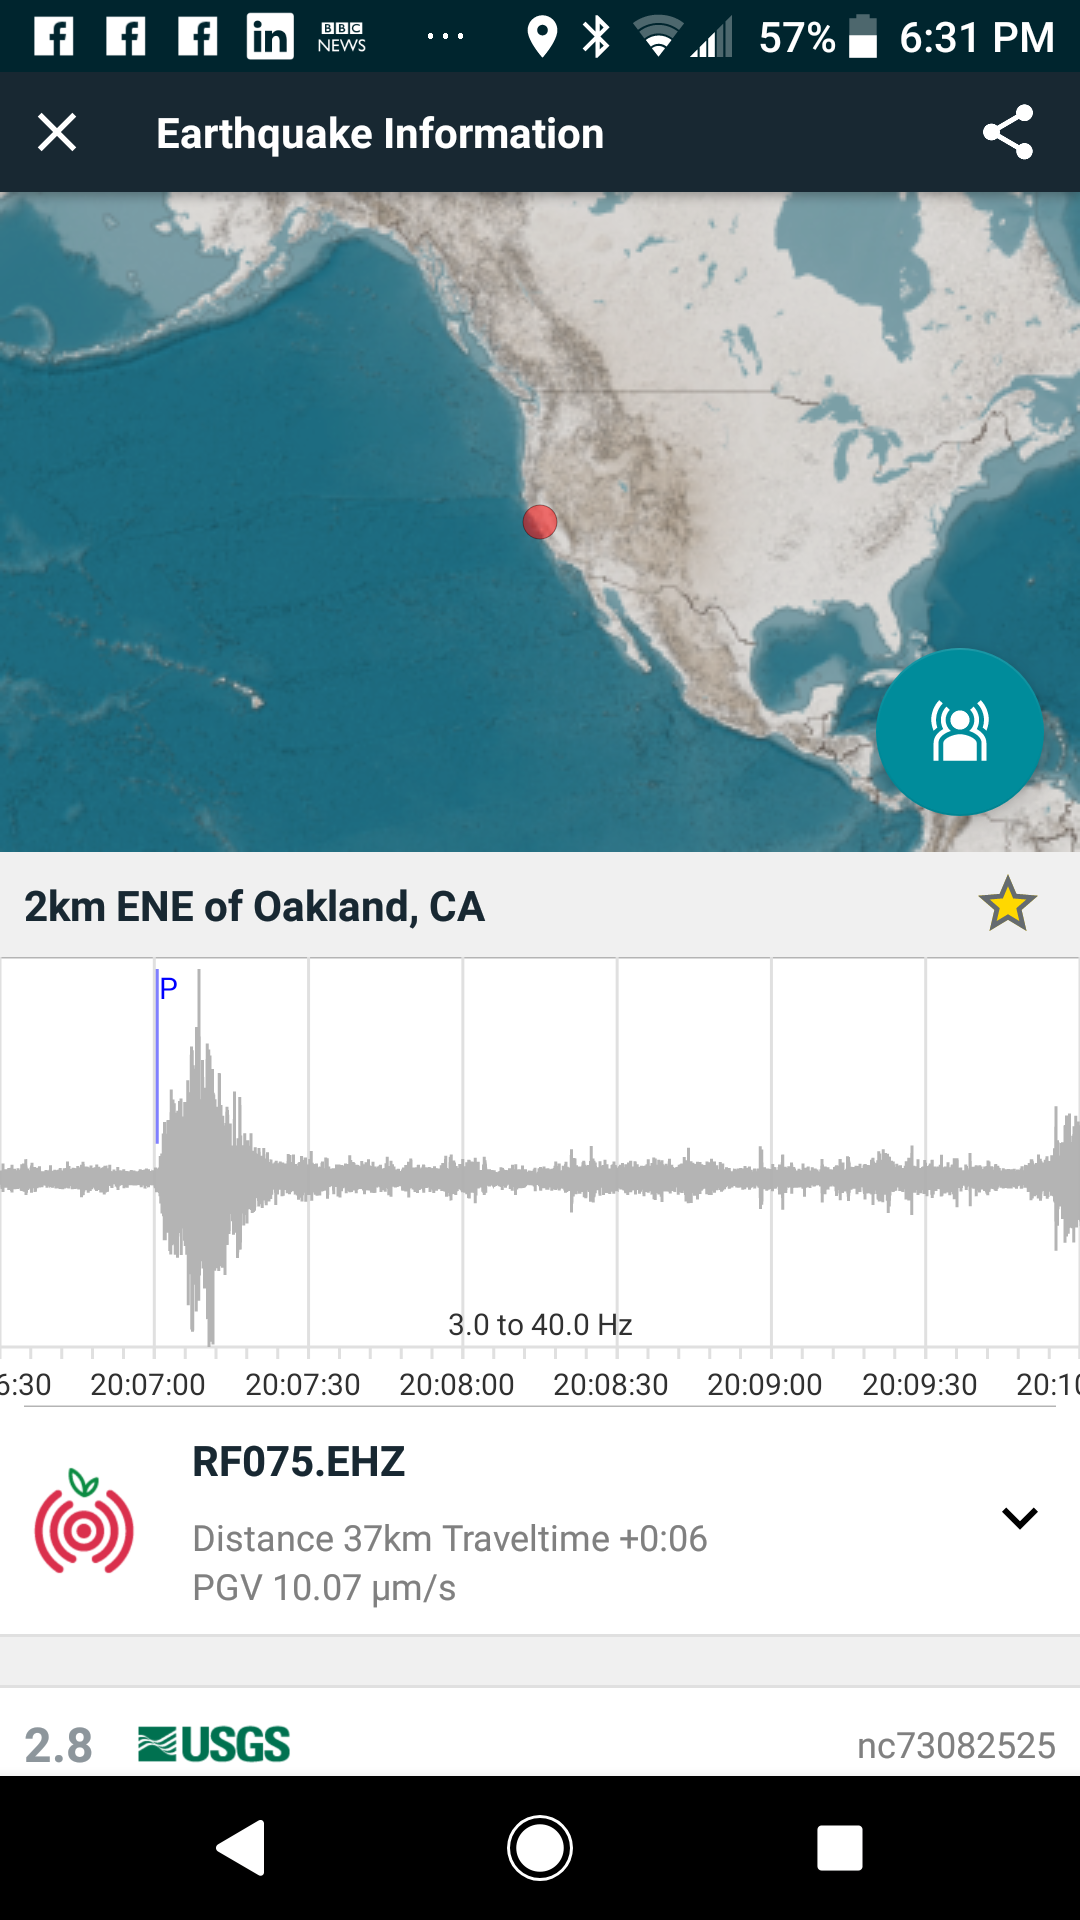
M2.8, 37km 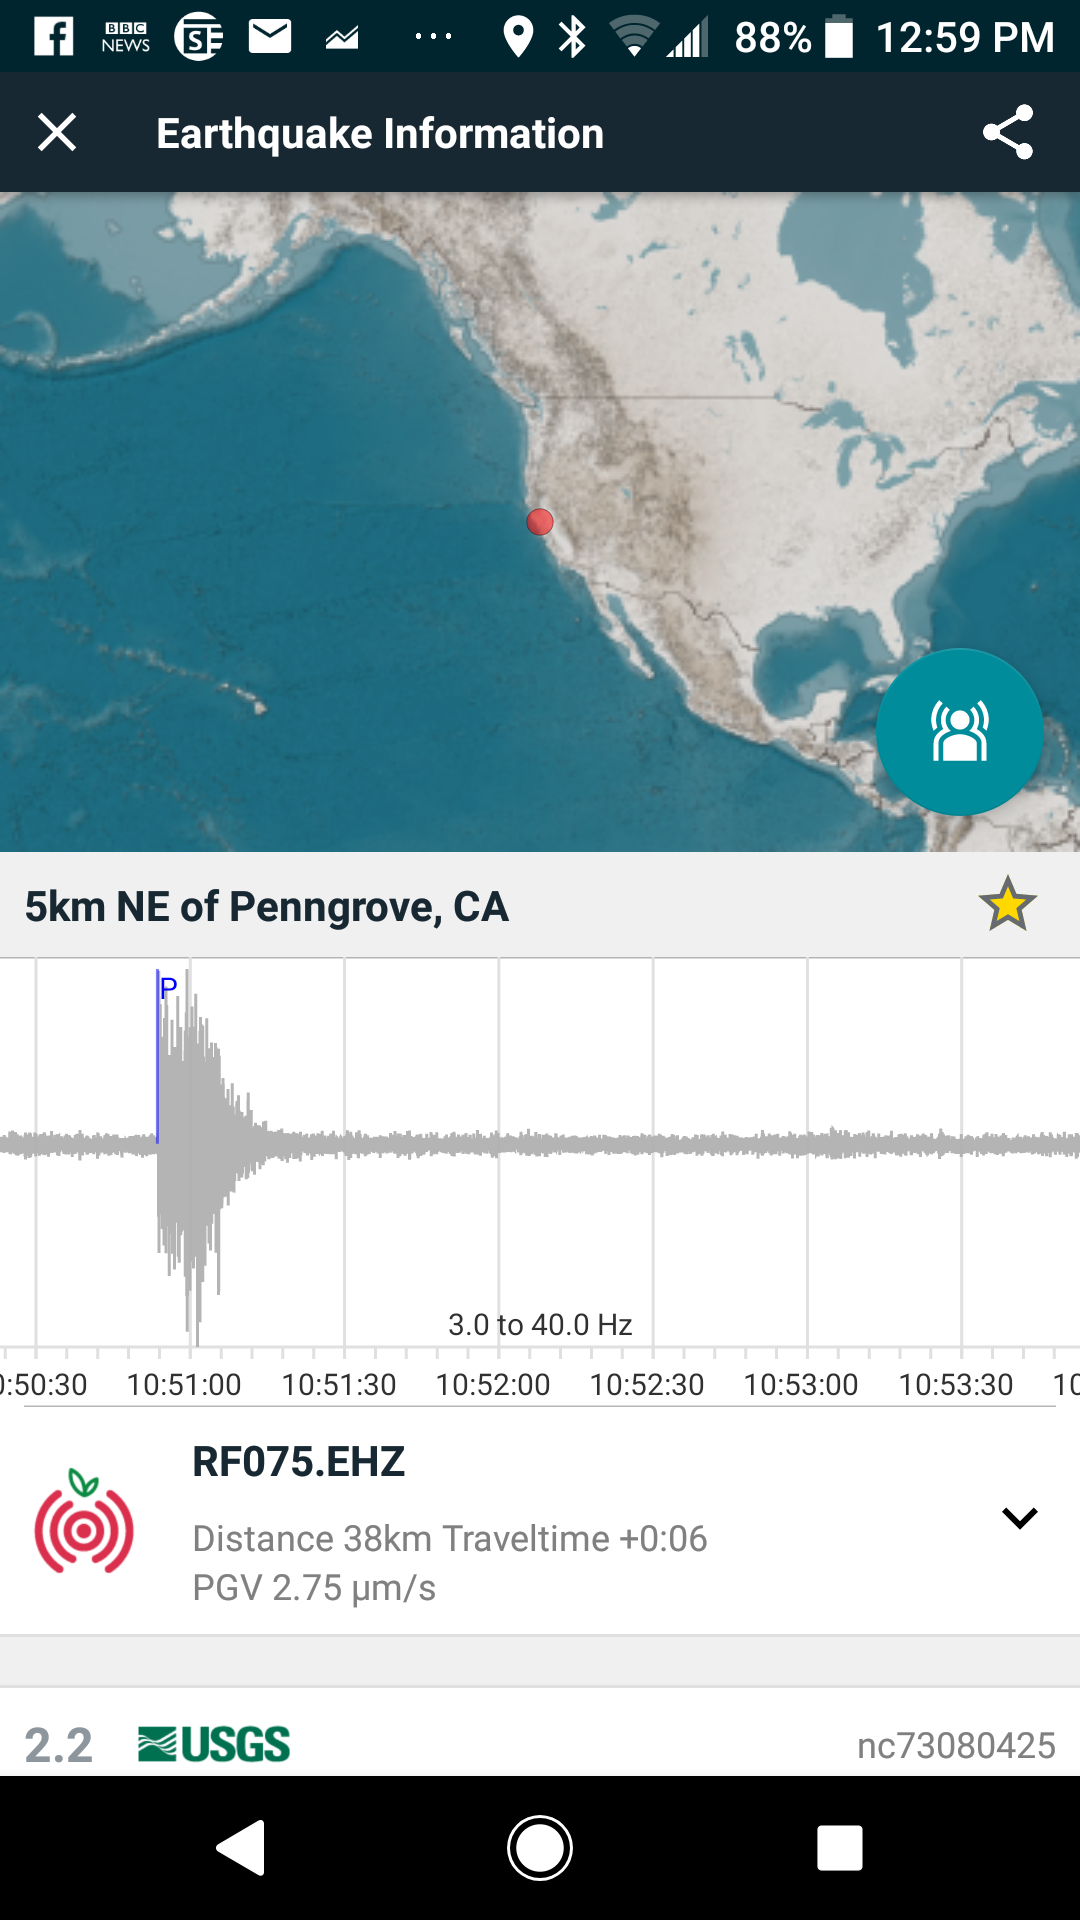
M2.2, 38km 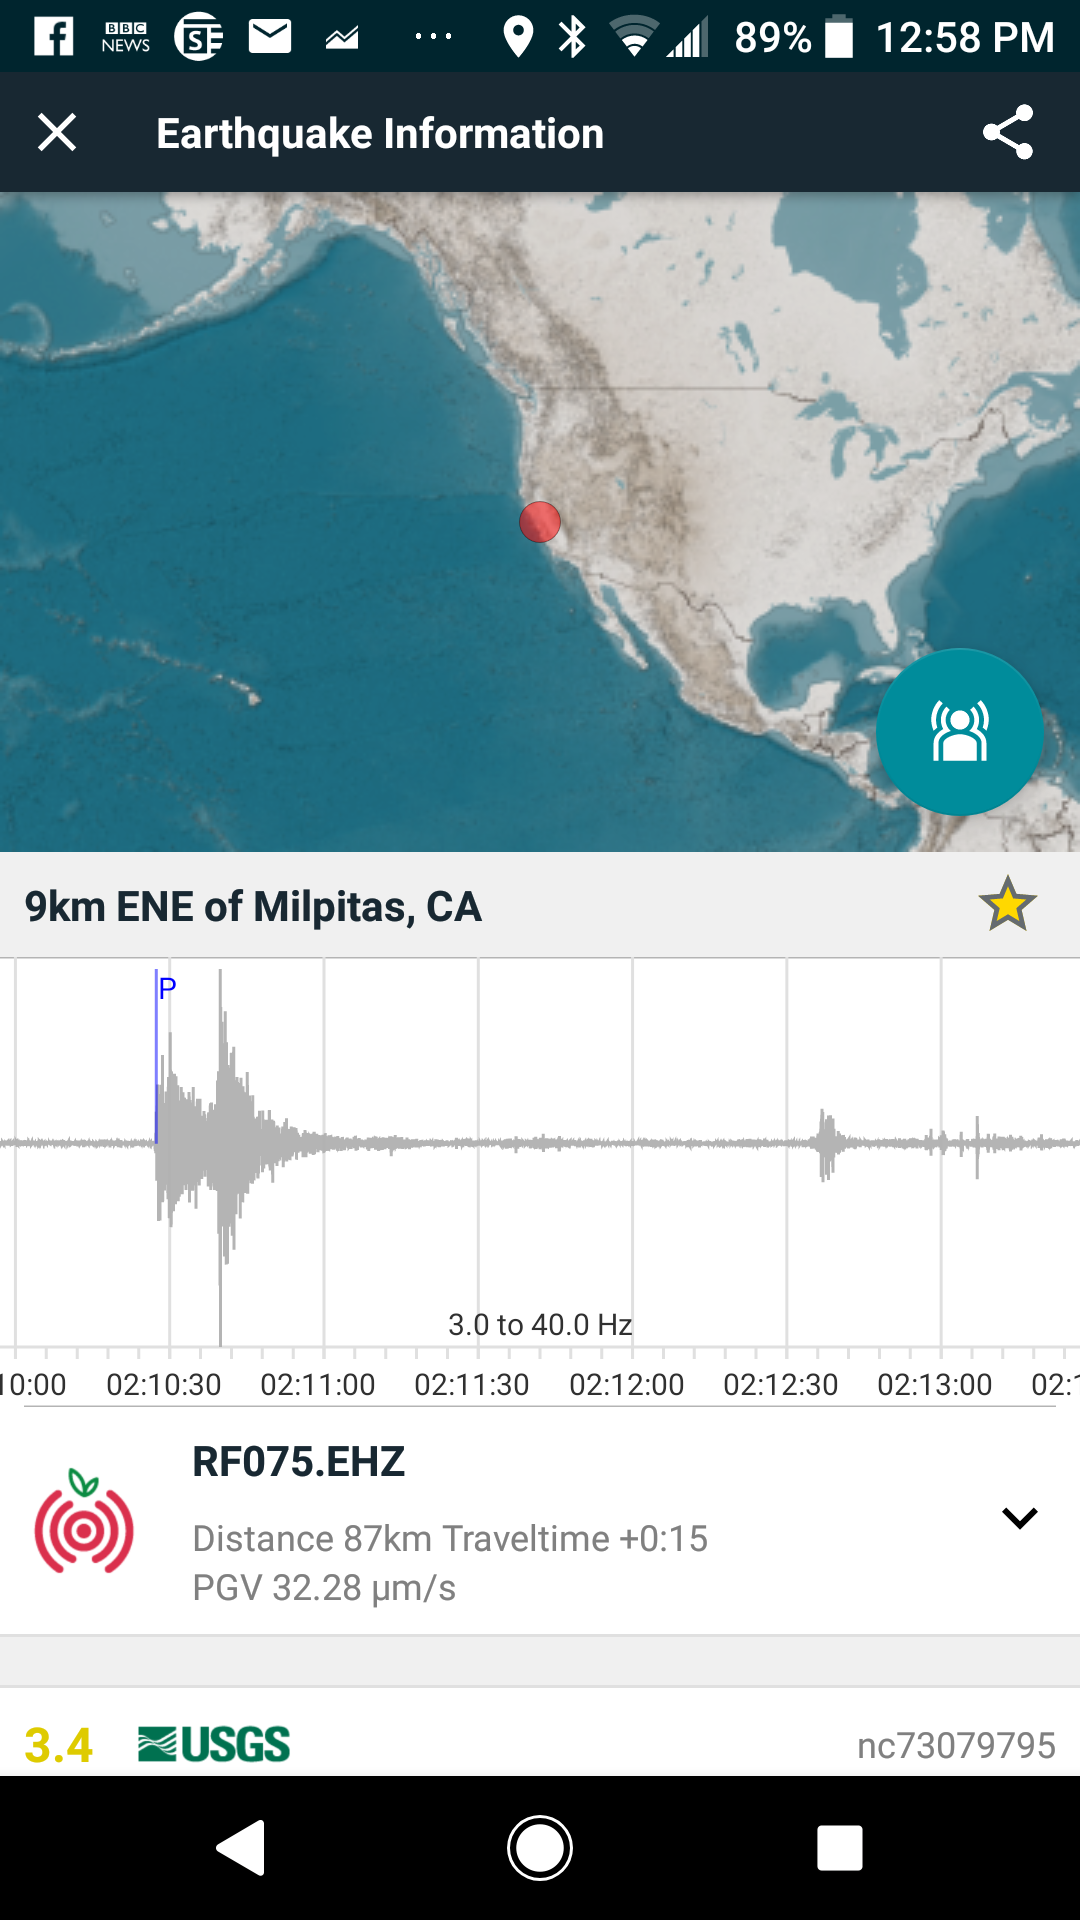
M2.8, 87km 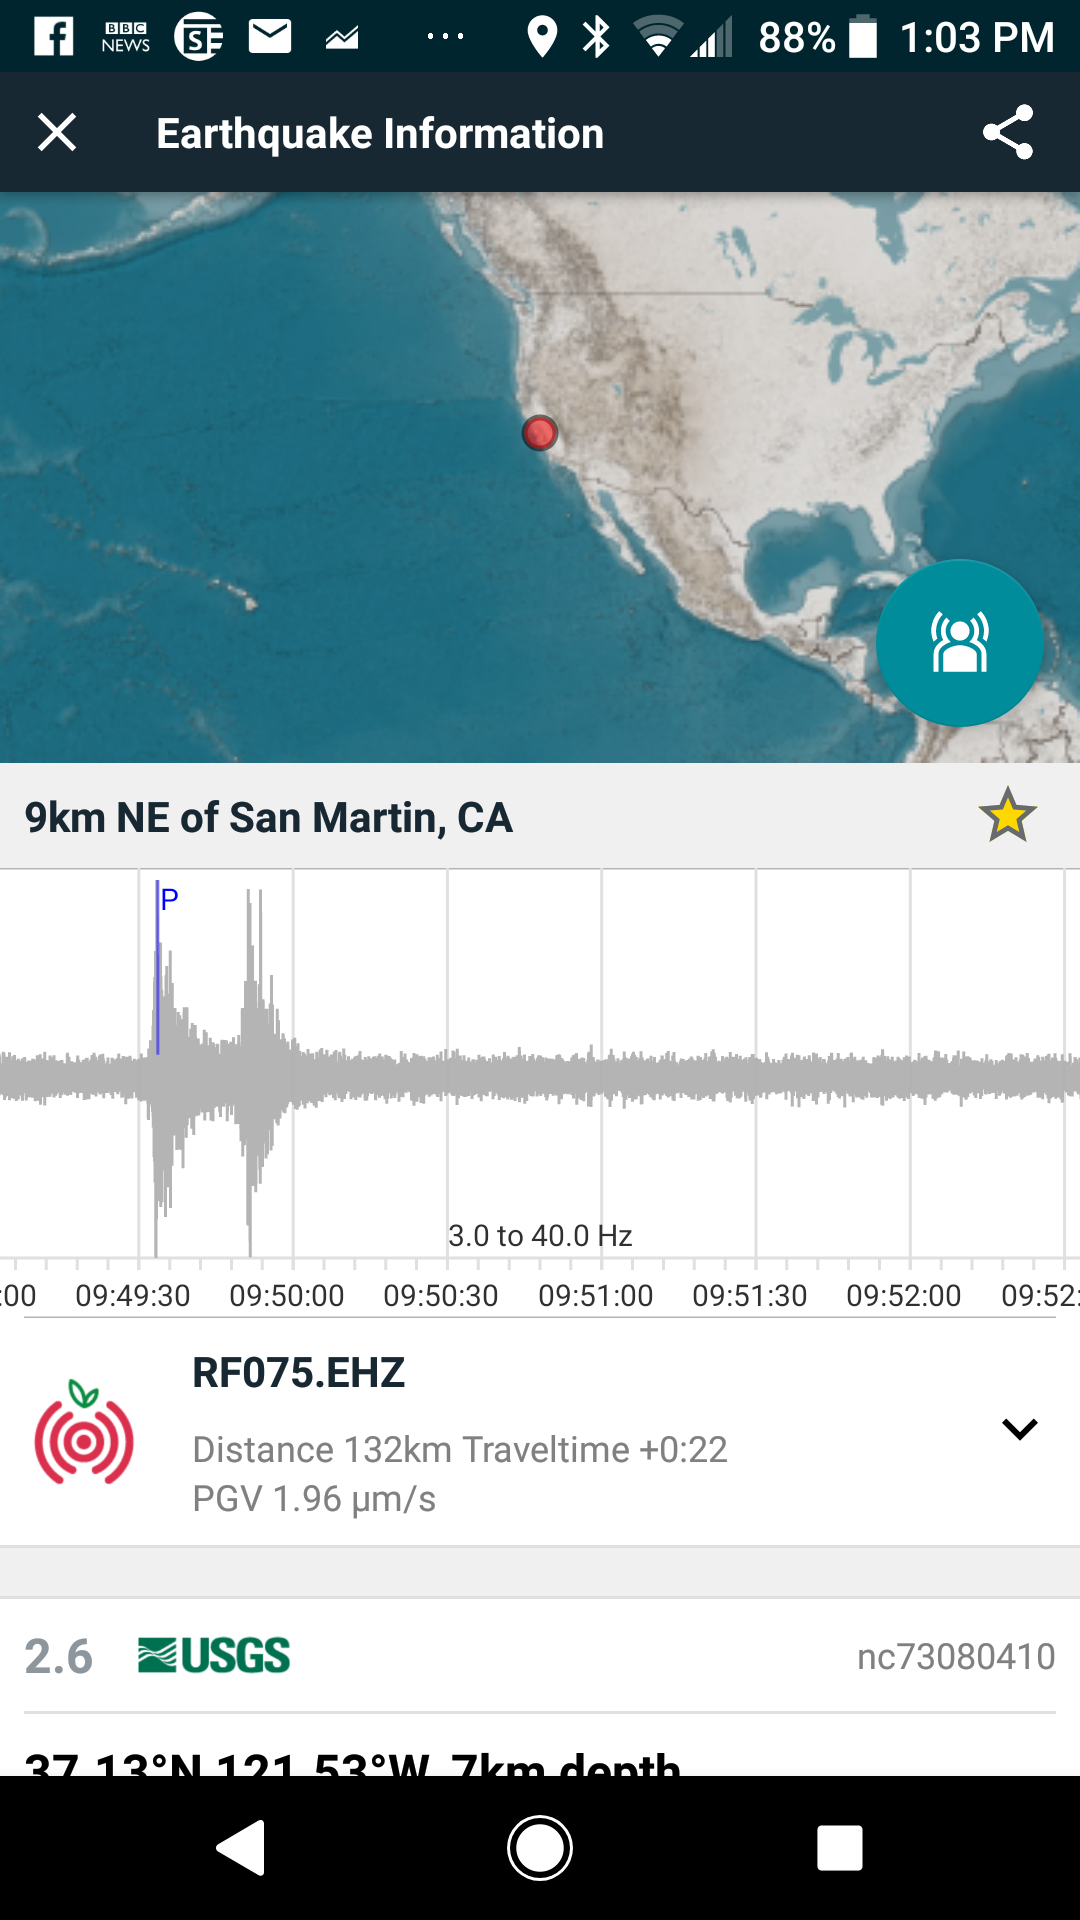
M2.6, 132km 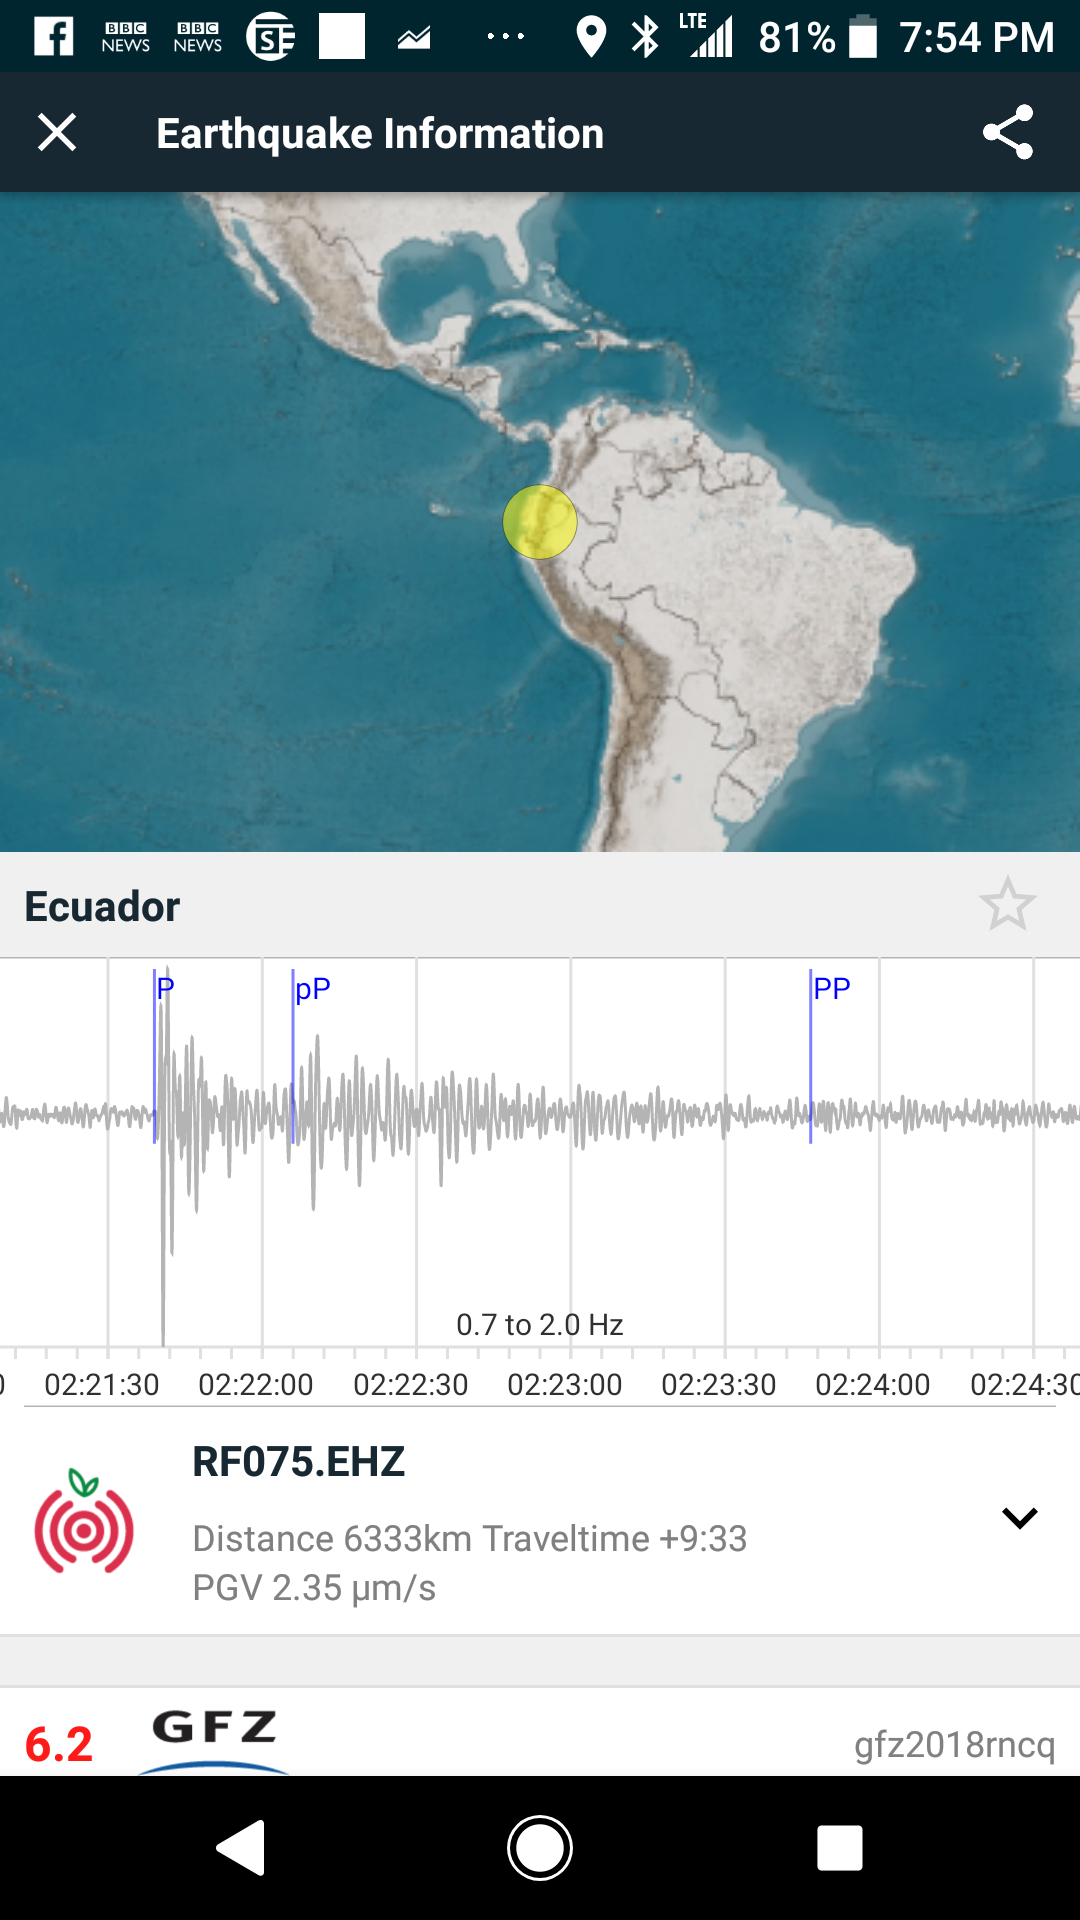
M6.2, 6327km 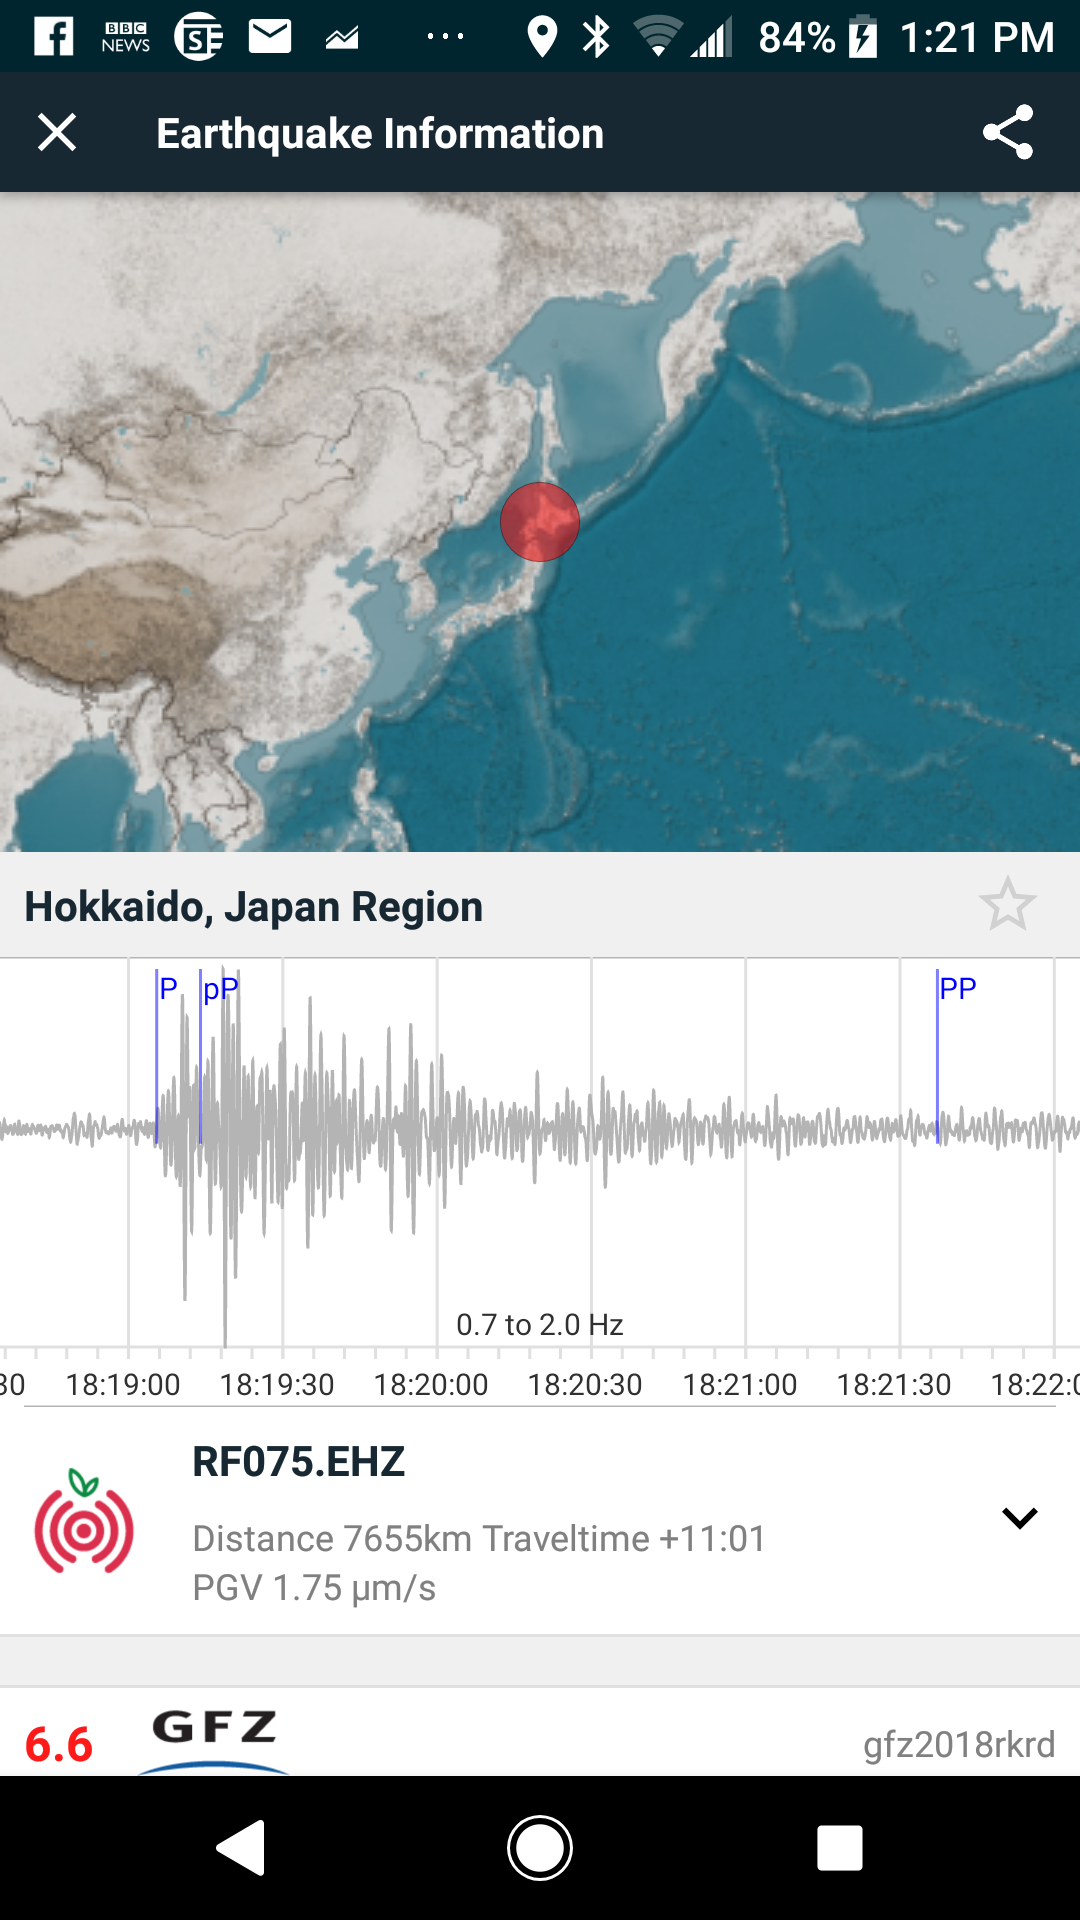
M6.6, 7655km 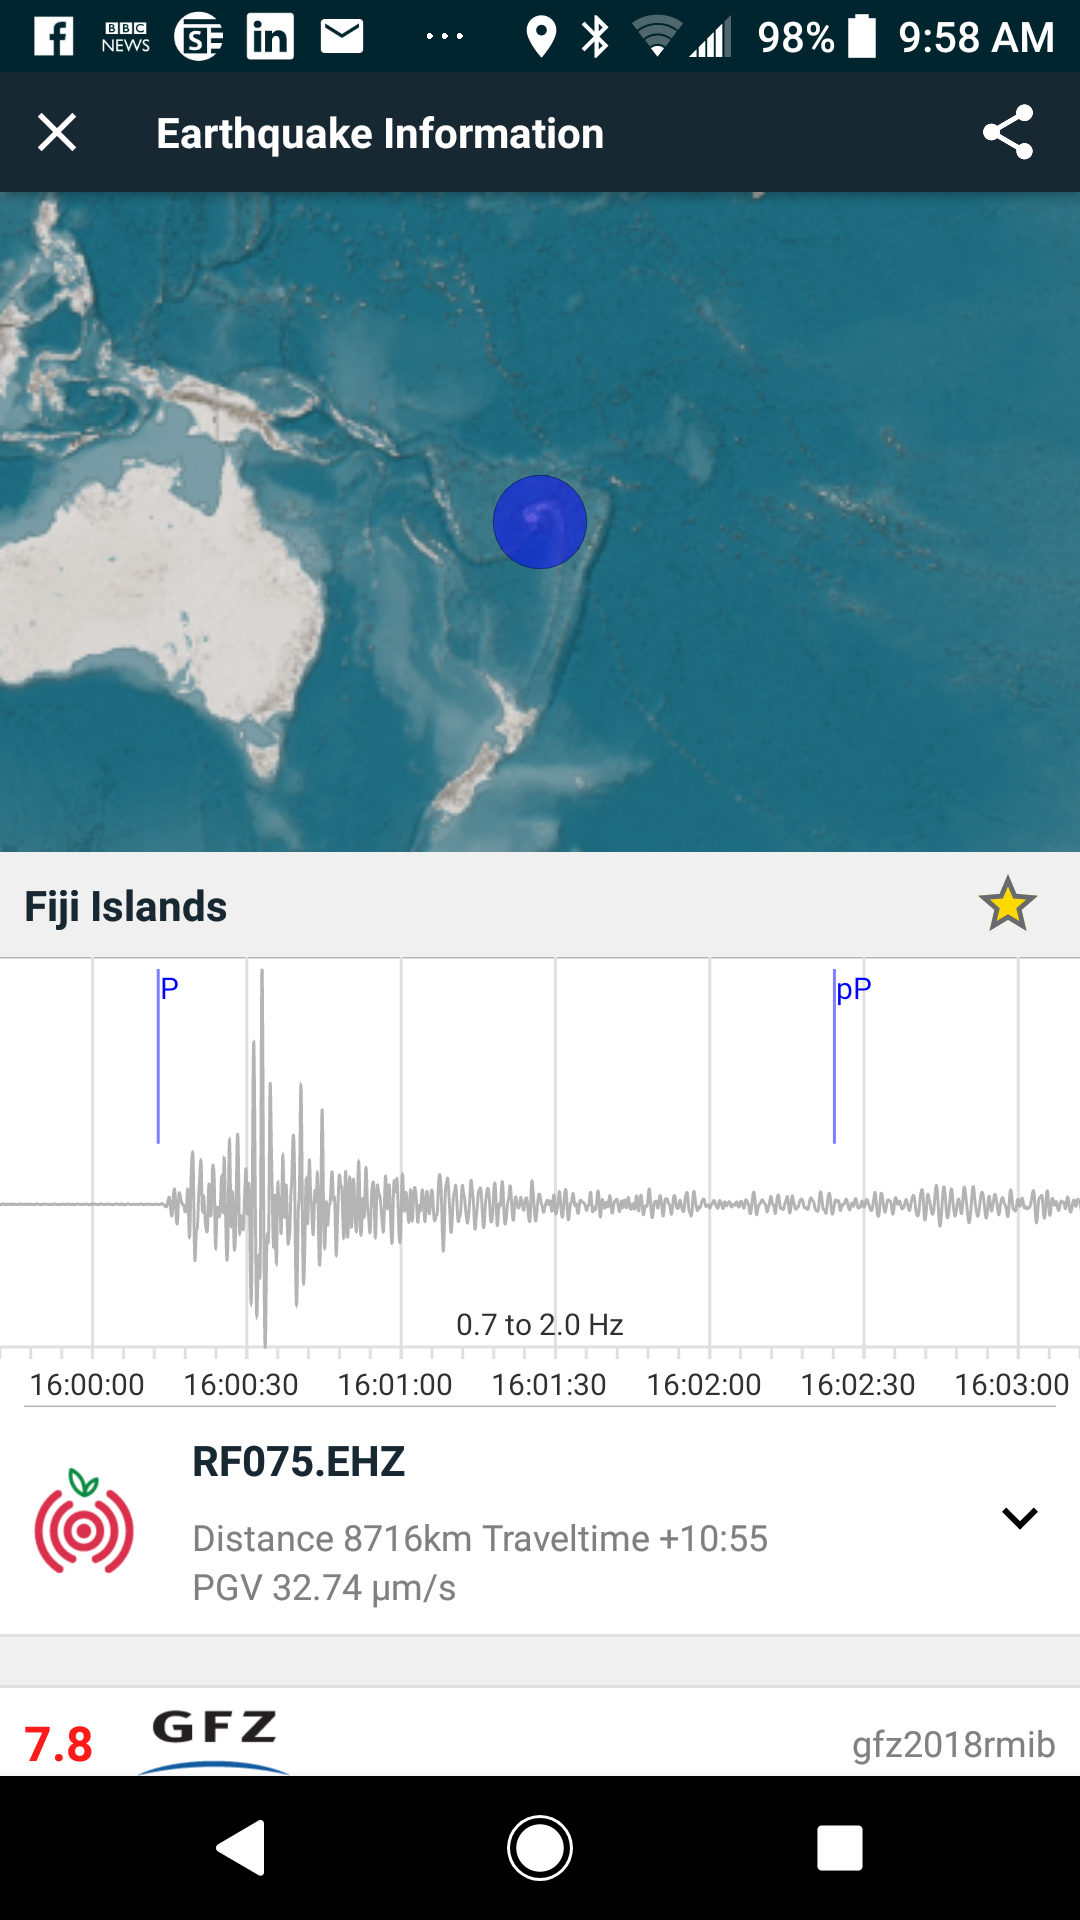
M7.8, 8716km
The app puts a blue line with the letter “P” at the time when the “P” wave, or primary wave, should theoretically have first arrived at my station. Actual arrival time may vary somewhat, because the details of the local dirt and rock near my area may vary somewhat from the model used to calculate the theoretical arrival time. But as you can see, it’s pretty close.
The closest quakes appear as one jolt, followed by an approximately exponential decay. As the quakes get farther away, you can see that the waves separate into two jolts, the “P” wave and the “S” wave. The “S” waves are typically a bit stronger than the “P” waves.
You don’t need to purchase a Raspberry Shake to use their software. Check it out on their site, and/or search for EQInfo on the Android App Store. You can even alter the settings and claim that you own Raspberry Shake with identifier RF075, to let you see the traces from my seismometer. Or you can find a seismometer on the map near your location, and use that one.